
Quantifying the Value of Dynamic Withdrawal Strategies in Retirement
KEY TAKEAWAYS:
- Dynamic withdrawal rules can dramatically increase sustainable spending, allowing retirees to start with up to 25–30% higher annual withdrawals without reducing the probability of long-term success.
- Adjusting withdrawals based on market performance narrows outcome variability, helping retirees avoid running out of money in poor markets while fully benefiting from strong ones.
- Few financial advisors actively use dynamic withdrawal strategies, making it even more important to seek out a retirement planning specialist to take advantage of these strategies.
As retirement planning specialists, we often meet new clients who take pride in designing a retirement spending plan that limits withdrawals to around 4% of their portfolio. .
Like many retirees, they’ve been influenced by the well-known 4% rule. Most people do not know the many flaws inherent in the 4% rule and just how conservative of a rule it can be for some (see our Insight entitled "Aim Higher Than "Not Running Out of Money" – Is Your Safe Withdrawal Rate Costing You Money and Quality of Life?" for more).
After interviewing many of these new clients, we often find they had no desire to pass with a pile of money, but rather that they wanted to maximize their level of spending (i.e., quality of life) during retirement.
Further, many of them have considered that if they came to a point during retirement where they found they would be unable to spend everything, they would rather gift money while living rather than at passing. While these clients were right to feel proud for their many years of responsible savings and spending, now was really a time to see just how much they could sustainably spend in retirement so they could maximize their quality of life during retirement. Unlike the supposedly “safe” withdrawal rate of 4%, dynamic withdrawal rules open the possibility of being able to achieve both goals - maximizing quality of life while reducing the need to worry about running out of money in retirement.
What Are Dynamic Withdrawal Rules Anyway?
We have written about dynamic withdrawal rules before, but the most important thing you need to know is that unlike fixed safe withdrawal rate rules (such as the 4 percent rule), dynamic withdrawal rules allow you to adjust your spending based on actual market performance and portfolio results over time.
Instead of locking yourself into a static withdrawal amount for life, you establish flexible guardrails that guide when and how to increase or decrease spending as conditions change. This approach helps you preserve your portfolio during down markets while giving you the freedom to spend more when returns are strong. This ultimately creates a smoother, more optimized retirement experience.
(See our insight titled How to Apply Dynamic Withdrawal Rules to Optimize Your Retirement Withdrawal Strategy for more details.)
Putting Dynamic Withdrawal Rules to the Test: Modeling the Baseline
To see how dynamic withdrawal rules can change real retirement outcomes, we illustrate with a sample client scenario. The client entered retirement with a $4million portfolio and their retirement spending plan called for a $172,000 net (after-tax) level of spending. Programming our spending sustainability software with the client’s information and the $172,000 level of inflation-adjusted net spending yielded a 99% probability of success using historical simulation analysis as can be seen below:
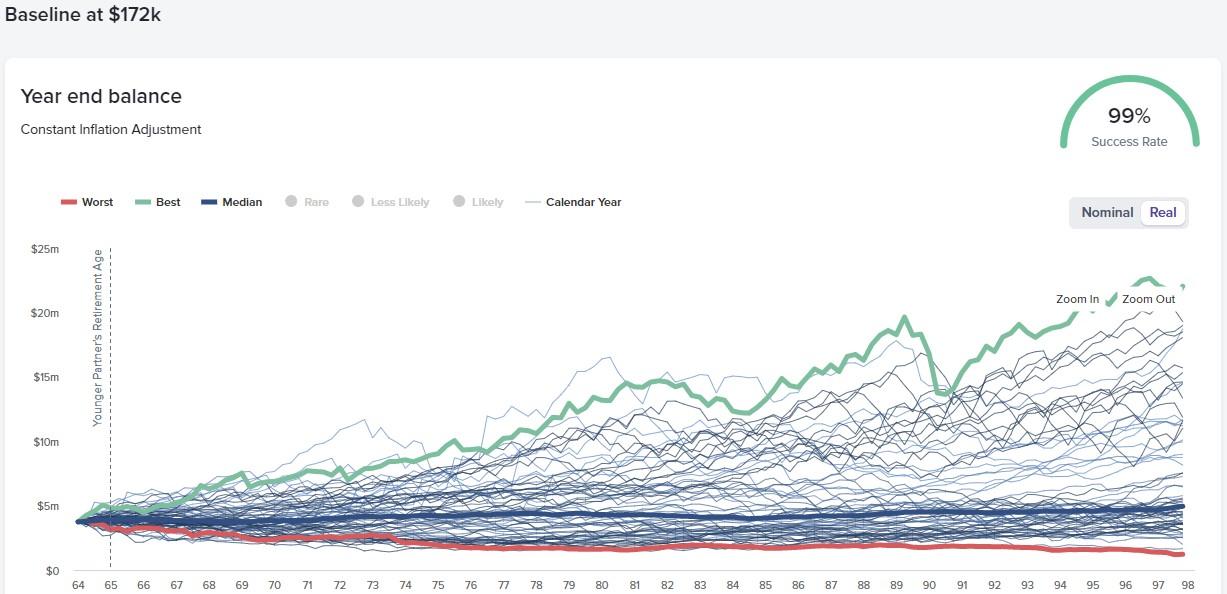
Historical simulation analysis is a complementary analysis to Monte Carlo, as they both have strengths and weaknesses. Historical simulation analysis takes the retirement plan programmed into the system and runs it through actual historically observed paths of returns to see how it would have performed. The red line is the worst-case historical observation, and it occurred in November of 1936, as can be seen in the snapshot below by hovering over the line:
Had this couple retired in November of 1936 with this retirement plan (and made no changes), they would have had $1.22 million left in real (i.e., inflation-adjusted today’s dollars) by the end of their 98-year life expectancy. These clients would have made a cumulative withdrawal of $3.59 million during retirement.
The green line is the best-case historical observation, and it occurred in July of 1982. Had this couple retired in July of 1982 with this retirement plan (and made no changes), they would have had $22.03 million left by the end of their 98-year life expectancy. These clients would have made a cumulative withdrawal of $3.74 million during retirement.
The Path of Returns Drives Variability in Outcomes
What is striking in this analysis is just how different the outcomes can be for the exact same retirement plan invested in the same 60% stock and 40% bond portfolio. There is a massive difference between the worst-case outcome leaving $1.22 million and the best-case outcome leaving $22.03 million, and these are real historical return paths that people actually experienced.
These different potential paths of returns are what leads to sequence of returns risk. Of the big five retirement risks retirees face, sequence of returns risk is the greatest. (See our Insight entitled "Evaluating the Big Five Retirement Risks Every Retiree Faces" for more.)
Modeling for Maximum Spending with Dynamic Withdrawal Rules
As soon as you start to model for higher spending levels, the probability of success starts to fall. For example, if we were to increase the baseline model of net spending from $172,000 to $220,000, the probability of success falls from 99% to 69%, as seen below:

The worst-case historical observation in February of 1973 would have left the plan with $0 at age 84, 14 years shy of the client’s 98-year life expectancy. The client would have had a cumulative withdrawal of $3.32 million during retirement before running out of money. Note that despite the $48,000 higher net withdrawal than in the baseline, the client’s cumulative withdrawal is $270,000 less because the portfolio runs out of money too soon.
The best-case historical observation in July of 1982 would have left the plan with $17.48 million by the end of their 98-year life expectancy. The client would have had a cumulative withdrawal of $5.60 million during retirement, $1.86 million higher than the baseline due to the higher spending goal.
Still striking in this analysis is the difference between the outcomes. There is still quite a difference between running out of money 14 years too soon or passing with $17.48 million still left. This is where the application of dynamic withdrawal rules can help us tremendously improve retirement planning outcomes.
Dynamic withdrawal rules allow us to adjust spending based on what has actually happened. By adjusting as we go, we are able to narrow the range of potential outcomes. Dynamic withdrawal rules allow us to still plan for the downside scenarios, but then increase spending if the lower probability downside scenarios do not materialize as you progress through your retirement. The net effect is a substantial boost in the amount a client can take from their portfolio without an increase in risk to spending sustainability. See our Insight entitled "Dynamic Withdrawal Rules -- A Significant Opportunity for Retirement Plan Optimization" for more.
Applying Dynamic Withdrawal Rules to Your Retirement Spending Plan
Placing upper and lower boundary rules as well as a minimum spending withdrawal floor, we are left with a very solid plan once again, as can be seen below:
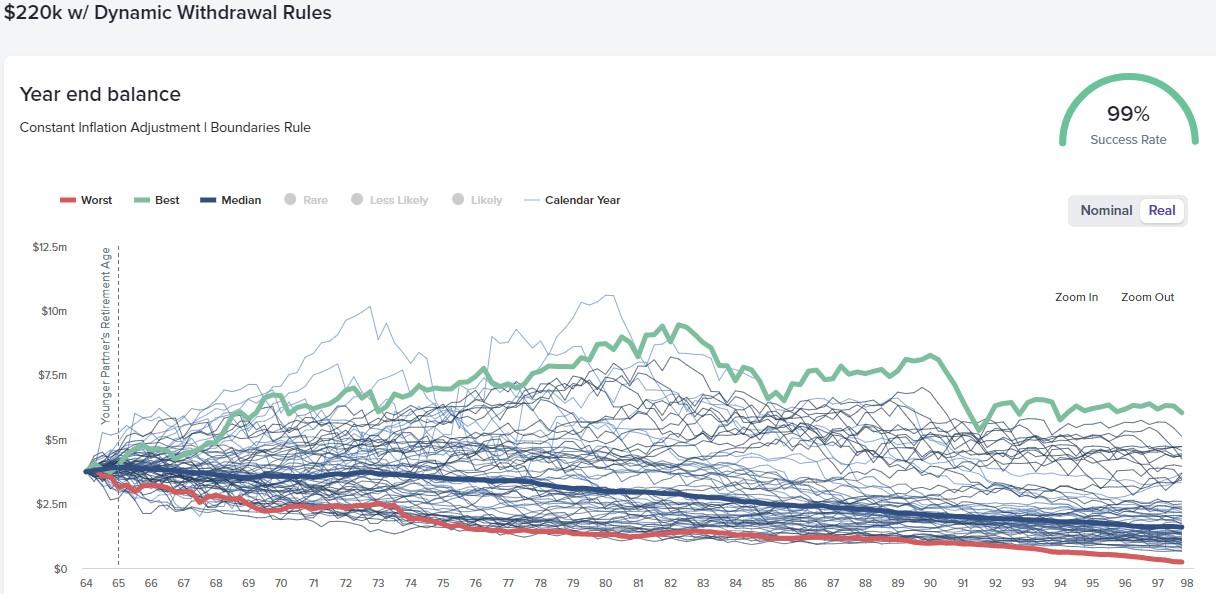
The application of dynamic withdrawal rules increased this particular retirement plan’s probability of success from 69% back up to 99%. Please note a 99% probability of success is not necessary or ideal, but this example does serve to isolate the value of applying dynamic withdrawal rules. Notice the narrower and downward slope of the potential outcomes compared to the graphs of the previous two scenarios. This is good and what we want to see if someone wants to maximize their spending during retirement. (Once again, if you wish to see step-by-step guidance on how to apply these rules to your retirement planning, see our Insight entitled "Determining and Implementing Dynamic Withdrawal Rules" for more.)
Quantifying the Value of Dynamic Withdrawal Rules
Dynamic withdrawal rules are one of the most powerful tools retirement planning specialists have in their tool chest. Vanguard, in their “Advisor’s Alpha,” and Morningstar, in their “Alpha, Beta, and Now… Gamma” research papers, both point to the material value of dynamic withdrawal rules.
Morningstar even goes so far as to say dynamic withdrawal rules can create more value than all of the tax-management strategies combined (fortunately, these things aren’t mutually exclusive because we believe in both strongly and apply both in practice). The value of dynamic withdrawal rules can be seen in quantifiable ways in the table below:
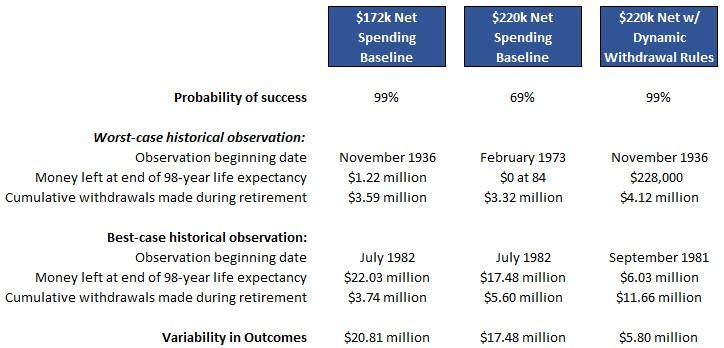
A couple of things pop out in looking at the table:
1). This couple can start retirement with a net spending goal of $48,000 (or 28%) more per year without affecting their probability of success by applying dynamic withdrawal rules.
2). Under the worst-case historical observation, this couple would have withdrawn $0.53 million (or 15%) more having applied dynamic withdrawal rules.
3). Under the best-case historical observation, this couple would have withdrawn $7.92 million (or 212%) more having applied dynamic withdrawal rules.
4). Because dynamic withdrawal rules make adjustments based on what happens as you go, the variability in outcomes narrows considerably from $20.81 million to $5.80 million.
4 Reasons You May Not Have Heard More About Dynamic Withdrawal Rules
If dynamic withdrawal strategies are so effective, you might wonder why they aren’t discussed more often—either in the media or by most financial advisors. This is a fair question. Unfortunately, the answer is a blend of the following distasteful reasons:
1). The financial advice and wealth management industry is a highly fragmented industry full of well-compensated individuals who have not needed to become more competitive and push themselves to serve clients better to be successful. We call this the “fat, dumb, and happy” problem in our industry. Economics will change this industry dynamic over the next 20 years, but it remains a problem today for consumers.
2). Media members only write/talk about what catches consumers’ attention (i.e., inflation, cryptocurrency, stock picks, other flashy stories), not necessarily what educates. Media members are also limited to what financial advisors know and are pushing/sharing.
3). The vast majority of financial advisors are generalists, advising clients on anything and everything. Most generalists lack the deep, more sophisticated knowledge that specialists who focus on a specialized area have. In fact, the two largest financial planning software systems (Money Guide Pro and eMoney), which together have a 77% market share, don’t even have the ability to model dynamic withdrawal rules. Fortunately, any good retirement specialist (see our Insight entitled “Retirement Specialist or Financial Advisor” for more) should have access to one of the two retirement planning specialist software systems that can accommodate the modeling of dynamic withdrawal rules.
4). The predominant pricing structure in the industry creates a massive conflict of interest for advisors to encourage a more significant drawdown of a client's investment portfolio. Depending on the study you look at, approximately 90% of “fee-only” registered investment advisors (RIAs) charge for their services based on the size of a client's investment portfolio. This pricing model is known as % Assets Under Management (%AUM). Most %AUM advisors are content to recommend something close to the 4% rule and watch your portfolio grow during retirement so they can make more. See our Insight entitled "Why a Flat-Fee Advisor is Best for Retirees" for more.
If you would like to see how the application of dynamic withdrawal rules can improve your possible retirement outcomes, our retirement planning specialists are happy to help. Get started now by scheduling your complimentary call and Thrive Assessment here.